Stardog Designer
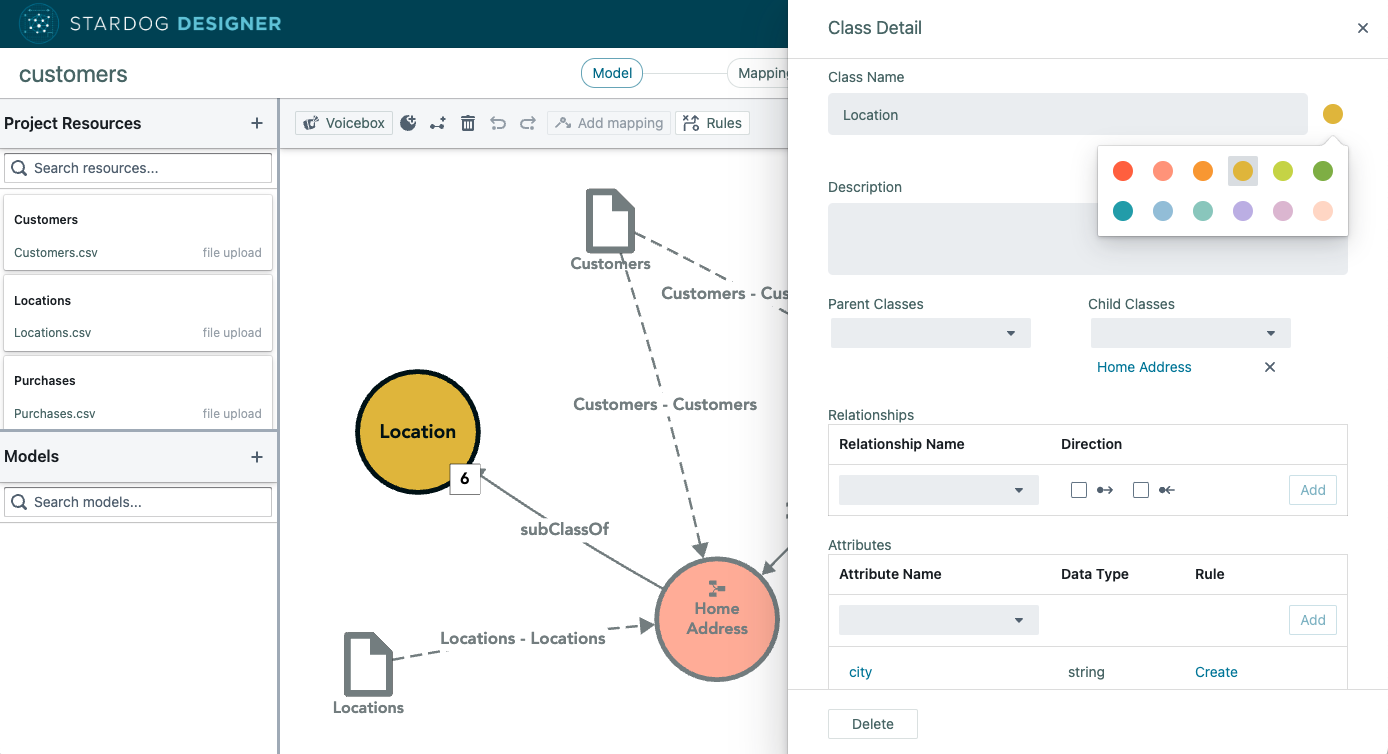
Stardog's core Designer product was directly based on my previous PhD work (see Origraph below); I was closely involved in designing and implementing this product from the ground up, as well as maintaining this project for two years.
Stardog Explorer
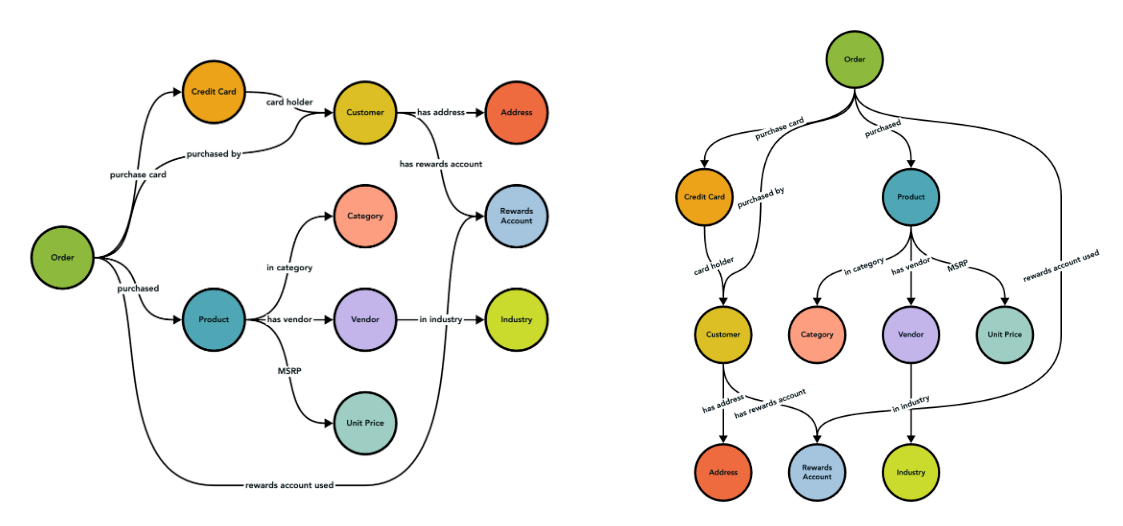
Although I joined shortly after Stardog's core Explorer product was released, I was responsible for designing and implementing major features (including graph layout improvements that almost made our CEO, Kendall Clark, "eat [his] hat" because he disbelieved that they were real)
Stardog Studio
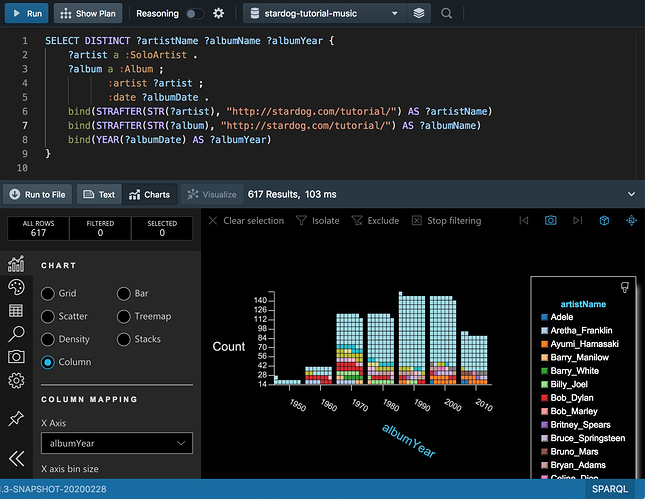
I was responsible for maintaing Stardog's core Studio IDE product and associated libraries, keeping a legacy project useful across major company changes.
Origraph
A visual tool for modeling data as a network that supports a rich set of network wrangling operations.
Hanpuku
Hanpuku is a tool for bridging d3.js and Illustrator. You can edit a d3.js visualization with Illustrator, and/or edit an Illustrator document with d3.js.
Data Wrangling Survey
How do people think about their data? Spatially? As a table? As a network? What happens if you introduce a different abstraction? (interactive survey results)
Traveler
A visualization system for profiling HPC performance and behavior, specifically for the HPX and Phylanx projects. In addition to UX research, this project involved some fairly involved backend algorithm design to make it possible to zoom into >100GB-scale, inter-linked trace datasets.
Jacob's Ladder
Jacob's Ladder is a system I built during an internship at IBM for browsing aggregate subsets of large graphs.
Resonant Lab
Resonant Lab is a system I built during an internship at Kitware to help make various DARPA XDATA projects easier to use.
Arizona Research Bazaar Website
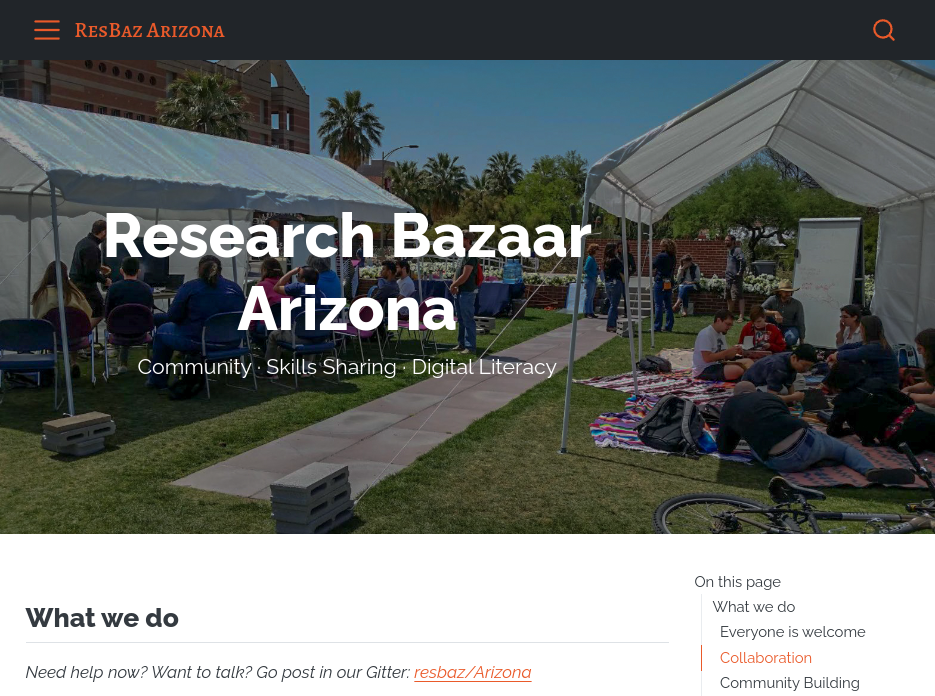
I helped rebuild the Arizona Research Bazaar website from scratch, including custom Quarto themes and widgets and some fun Github API hacks.
HCW HOSTED Housing Map
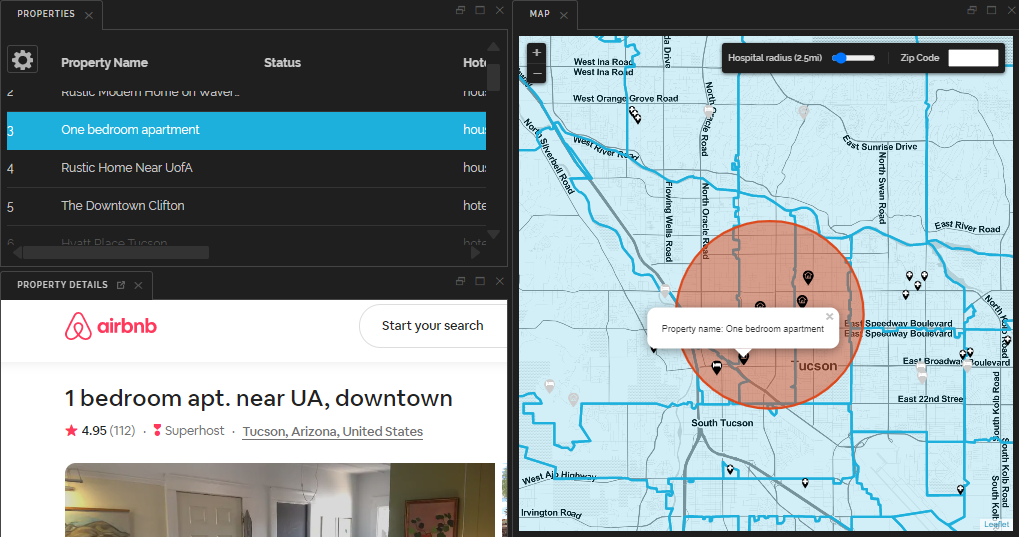
A small project for HCW HOSTED to help case workers find housing for healthcare workers during the COVID-19 pandemic.
uki.js

A minimal, d3-based Model-View framework for building larger linked view systems. Although I haven't been able to maintain it as well as I'd like, it's been used in a few projects, including this website!
SCI Ping Pong Tournament Interface
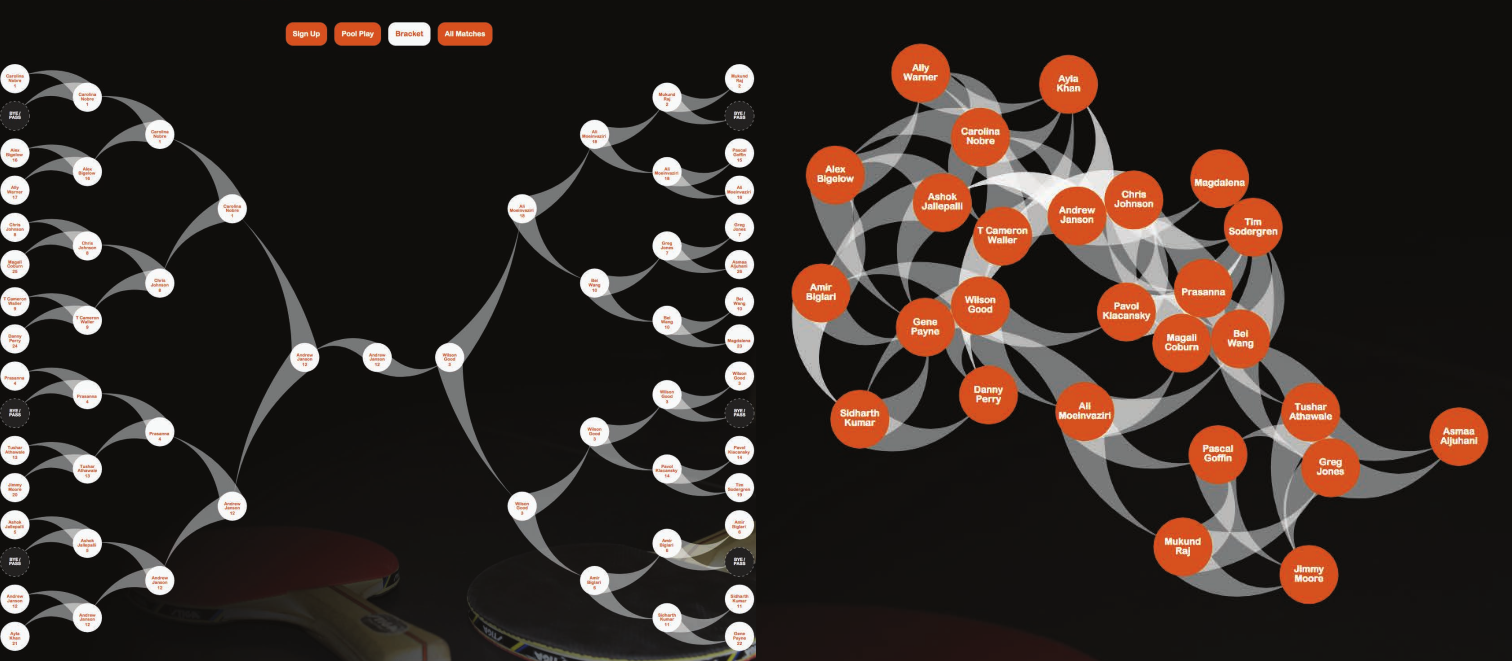
An interactive bracket for an in-house ping pong tournament at the SCI Institute.
SCI X Map
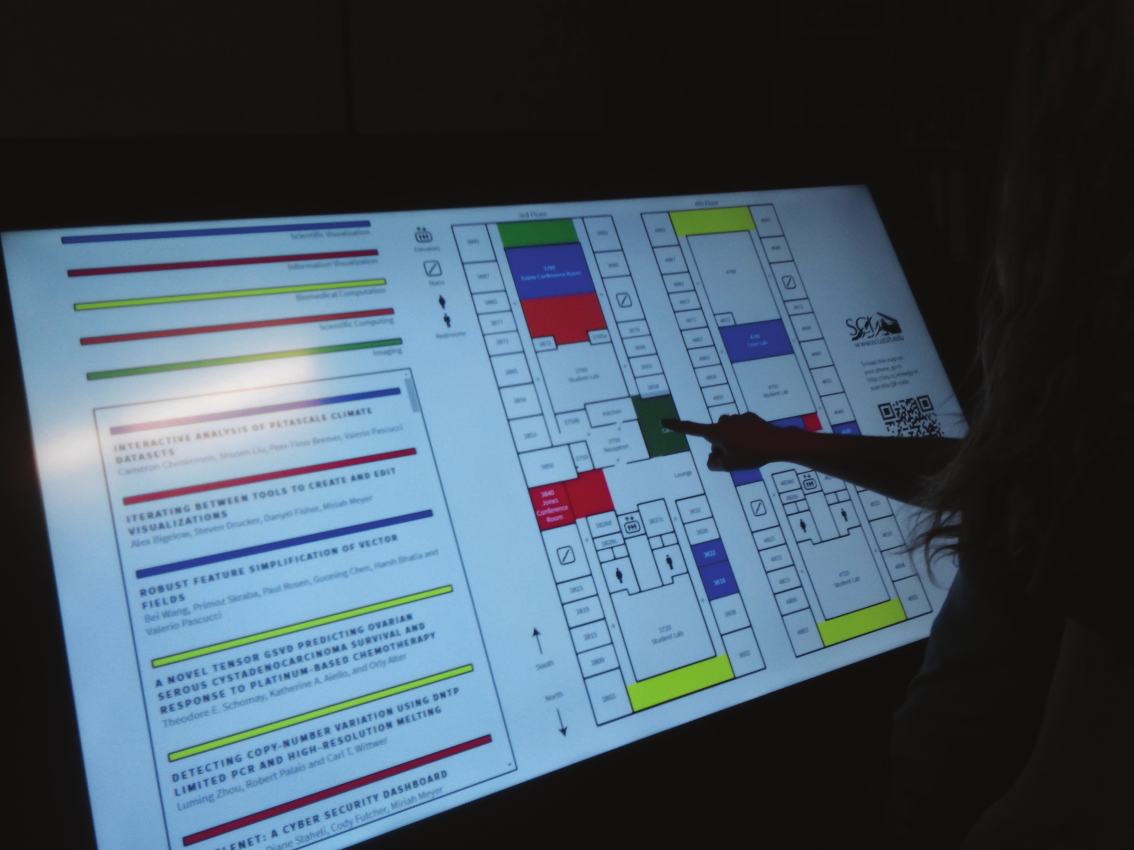
An interactive map that was displayed on a touch table for the 2016 SCI Institute Technical Exchange (SCI X).
calendar-creator
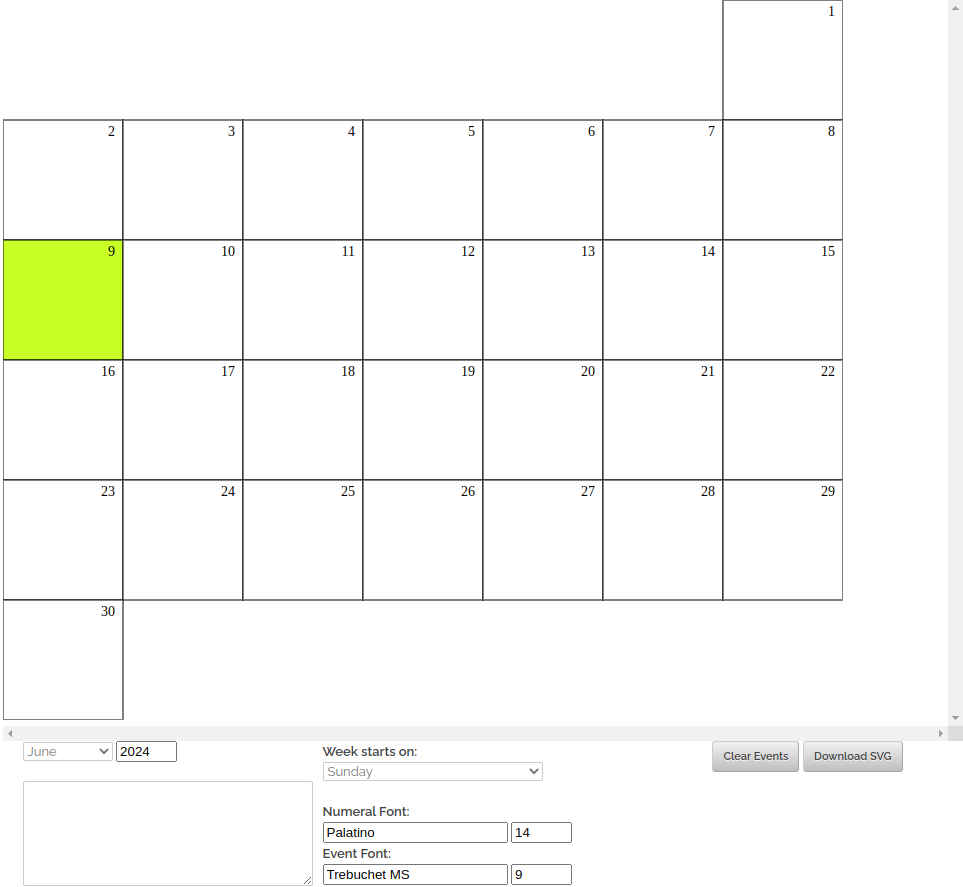
A simple, few-frills interface for creating minimal SVG calendars. Mostly listing here as my first open source project that has had community pull requests!